Welcome to PICU Doc On Call, a podcast dedicated to current and aspiring intensivists. My name is Pradip Kamat
My name is Rahul Damania, a current 2nd year pediatric critical care fellow. We come to you from Emory University,School of Medicine, Children’s Healthcare of Atlanta, Atlanta, GA.
Today’s episode is dedicated to O2 delivery in the PICU. We would like to highlight in this episode Stanford University School of Medicine Pediatric Critical Care’s LearnPICU website. The LearnPICU.com website Is dedicated to reviewing clinical topics related to pediatric critical care, and is an open access resources which Is widely accessed worldwide. The website has over 10,000 visits each month, and is managed by Dr. Kevin Kuo – Clinical associate professor of pediatrics pediatric critical care at Stanford University. Dr. Kuo has Been featured on our prior episode entitled seven habits of highly effective Picu fellows, and we are very excited to collaborate with his educational resources to provide you the listener a comprehensive educational experience.
Rahul, let’s go ahead and get into today’s case.
A 17-year old boy is admitted after he was struck by a car at slow speed while crossing the street.
He is has SPO2 of 98%, HR 98 bpm with a normal capillary refill and perfusion.
His blood gas at admission to the PICU reveals a ph of 7.3/PCO2 35/PaO2 196 mm Hg on 50% NRB with 100% O2 flowing at 12LPM.
His admission hgb is 10.5 gm%.
4 hours post admission, the nurses noticed that the patient is tachycardic to 150s, with a drop in his BP, delayed capillary refill, with cool extremities and increased output from the chest tube.
His SpO2 has decreased to 86% and PaO2 on his blood gas is now 65mm HG. He is found to have a POC Hgb of 6.8 mg/dL.
Let’s take this case and highlight key components of O2 delivery and O2 consumption.
Lets focus on O2 delivery first. Rahul What are the components of O2 delivery ?
Pradip, O2 delivery is made of O2 content X Cardiac output
Simply put, O2 content is the amount of blood present in 100ml of arterial or venous blood. Its is denoted by CaO2 or CvO2 and its unit is mL O2 / dL blood or mL O2 per 100 mL of blood.
Before we introduce the complicated formula, let’s just appreciate the variables within the equation.
Oxygen content is going to be a function of three variables:
This is going to be Hgb, Saturations on the hemoglobin also known as SaO2, and the amount of oxygen that is dissolved within the blood also known as your PaO2.
Pradip, Can you elucidate further about O2 content?
O2 content is given by the formula: CaO2 = (1.34X Hgb gm/dl X SaO2) + (0.003X PaO2)
Important points to remember about above formula is that the constant 1.34 (or 1.36 as given by some textbooks) is the amount of O2 in mL bound by one gm of Hgb and is called as the O2 carrying capacity of Hgb. In a healthy person say with 15gm% of Hgb, the O2 carrying capacity is about 15X1.34 = 20gm%.
Now many times amount of O2 bound to Hgb may not always reflect 100% saturation So we need to factor the % oxygen saturation into the oxygen carrying capacity of the Hgb.
The final element is to understand that some oxygen is dissolved in the plasma and is calculated using a constant 0.003 X PaO2. Typically 100ml of arterial blood with a saturation of 100 will contain 100 X 0.003 = 0.30ml of dissolved oxygen.
Rahul can you calculate the pre-decompensation oxygen content in the above case?
The above patients hgb pre-decompensation = 10.5gm%. His room air saturation 98% and his PaO2 is 196.
CaO2 = (1.34X10.5X0.98) + 0.003 X 196 = 13.7 + 0.58 = 14.2ml O2/dL blood.
Great – what is the post decompensation CaO2.?
The post decompensation CaO2 can be estimated using same formula as above: CaO2 = (1.34 X 6.8 X0.86) + (0.003 X 65) = 7.8 + 0.195 = 7.9 O2/dL blood.
Exactly So if you see the pre and post bleed O2 content just with a drop in Hgb from 10.5 to 7.5gm/dL: There is almost a 38% decrease in patients O2 content (8.83/14.2 = 62%,)
What is the best strategy to increase the patients O2 content?
First we can increase the patients FiO2 from 50% to 100% (immediate bedside action). We can get consent from family to order blood for transfusion.
Increasing FiO2 will result in an CaO2 = (1.34 X 6.8 X1 ) + (0.003 X 65) = 7.8 + 0.195 of about 9. O2/dL blood.
If we transfuse to a hgb of 10gm% with no increase in FiO2: we will get an CaO2 of (1.34X10X0.86) + (0.003 X 65) = 11.52 + 0.195 = 11.71 ml O2/dL.
The summary of this is to understand that modulating the patients hemoglobin via transfusion gives greatest bang for your buck in terms of optimizing O2 content
Exactly. Now, there is some value of increasing PaO2 in patients with acute severe hgb (say a Hgb of < 3gm/dL). Placing a child on 100% FIO2 NRB or placing child in hyperbaric chamber (diving & increasing PaO2) can increase CaO2 significantly. This is rarely used however may be indicated in patients who present with severe anemia with difficulty finding blood for transfusion due to antibody development etc.
Except for acute severe symptomatic anemia,Hgb should not be the sole criteria to transfuse to improve O2 content. In fact recent studies report that liberal policy of transfusion may be associated with increased mortality compared to a more restricted (transfused only if Hgb < 7gm/dL). So you want to assess the clinical picture fully and identify, intervene, and reassess.
Rahul, can you create a mental model related to O2 content in the blood for our listeners?
Absolutely, I would like to create 2 mental models:
As we reviewed, the variables in the oxygen content equation are:
- Hgb
- SaO2
- PaO2
- So how do we measure these clinically?
- Well, in order to get the Hgb you order a CBC
- In order to get your SaO2 you would place the patient on a pulse oximeter
- In order to obtain your PaO2 to you or draw an ABG
Thus, your total oxygen content can be thought of as CBC, pulse ox, an ABG.
This is great – What’s another way to think about CaO2?
You can think about CAO2 by visualizing a car.
Many of us have heard that hemoglobin is the car which carries oxygen throughout our body. So the car and its frame represents hemoglobin. The wheels on the car represents the saturations. Four wheels on a car, for binding sites on hemoglobin. And finally thinking about a car needing to travel on a fluid road, helps you remember that PaO2 is the dissolved O2 in the plasma.

Pradip, we also talked about Venous oxygen content. How is that calculated?
CvO2 is similar to CaO2 and it is calculated using the formula: 1.34XHgbXSvO2 + 0.003 X PvO2
Typically, mixed venous O2 sat is used instead of SaO2 and PVO2 is used instead of PaO2. The blood gas is typically obtained from a central venous line with tip at SVC-RA junction.
Now thtat we have defined CaO2 and CvO2 lets talk about the other component of O2 delivery and that is CO. remember DO2 = CaO2 x CO.
Exactly, going into our Car analogy:
Hgb representing the frame SaO2 being the wheels on a car and PaO2 being the fluid road which the car travels on,
Remember that a car cannot run without a motor. SO what is that motor? It is CO.
So just to summarize DO2 = CaO2 x CO.
So Rahul, what is the AVO2 difference?
It is The difference between CaO2 and CvO2 can be used as a measure of the adequacy of O2 delivery. Typically in a normal patient the CaO2 is about 20.5 mL O2/dL and the CVO2 is about 14.5mL O2/dL giving us an AVDO2 of 5mL O2/dL. The normal range is 4-6mL O2/dL.
A decrease in DO2 will lead to higher O2 extraction and therefore a higher AV O2 difference. A lower AV O2 difference is seen when there is decreased O2 extraction such as in cyanide toxicity or sepsis.
Rahul, lets shift gears to the next heading of our talk O2 consumption or VO2 – can you introduce this to us?
VO2 is the amount of oxygen consumed by the tissues per minute. Certain condition can result in low VO2 such as hypothermia in the absence of shivering sedation/paralysis, coma, brain death, cyanide poisoning etc. Increased VO2 is seen with fever, pain, shivering, increased work of breathing, positive inotropes etc. VO2 (mL/min) is given by (CaO2-CvO2) X cardiac output, which uses the reversed Fick equation. VO2 = CI X AVDO2. IN ARDS or sepsis, VO2 may continue to increase even as DO2 increases above normal values. VO2 remains supply dependent to much higher levels of DO2 leading to pathologic supply dependency. The exact reason for this pathologic supply dependency is unknown.
Pradip, help us understand O2 Extraction a bit more?
It is important to understand that the DO2 in humans is around 620+/- 50mL/min per square meter. The O2 consumption in humans is typically in the range of 120-200mL/min per square meter. The body normally extracts only about 25% of the oxygen delivered to the tissues overall. O2 extraction (ERO2) is given by DO2/VO2 = 25%. OR AVDO2/CaO2. O2 extraction can vary by organ-the heart, brain extract a lot of oxygen but the kidneys, liver utilize little oxygen.
Global impairment in oxygen delivery can thus be determined by monitoring central venous oxygen saturation (measured at SVC-RA junction with a central venous line) or mixed venous oxygen saturation (measured with a Swan Ganz catheter at the pulmonary artery).
Normal ScvO2 = 70-75% reflecting an O2 extraction of 25%
It is important to note that in humans: O2 consumption or VO2 is independent of O2 delivery or DO2.
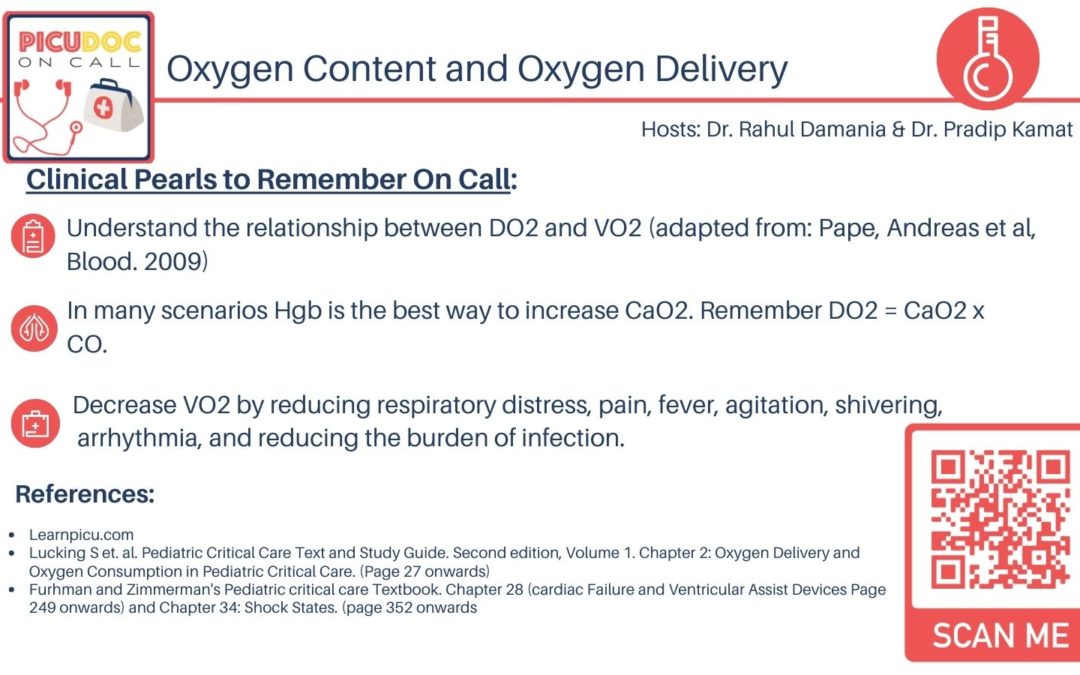
As the oxygen delivery decreases (or as oxygen demand increases), the body responds by extracting more oxygen and hence, the mixed venous saturation (ScvO2) or its oxygen saturation of blood at the SVC-RA junction gradually decreases to reflect this increasing oxygen extraction. However, the body can only extract so much oxygen and eventually, a critical extraction threshold (critical point of oxygen delivery) is met and cellular metabolism becomes anaerobic with the subsequent production of lactate. I would advise listeners to visit learnpicu.com to see an important graph drafting the relationship between DO2 and VO2.
An important component of oxygen delivery is Cardiac output: Rahul can you tell us the components of cardiac output?
Rahul: CO (liters per minute) = HR(beat per minute) X SV(mL). Cardiac output is typically indexed to BSA. CI is given as CO/BSA
Listeners need to remember that newborns and children with heart disease cannot increase stroke volume and are therefore heart rate dependent to increase cardiac output. Any rate or conduction anomalies can affect heart rate as in myocarditis, arrhythmias or poisoning.
SV is amount of blood pumped at each contraction and is dependent on preload, pump function and afterload.
Preload is the stretch of the cardiac myocytes just prior to contraction. Left ventricular end-diastolic volume, which is the volume of blood in the (L) ventricle just prior to contraction is the best surrogate marker of systemic preload. Preload is decreased in hypovolemia, hemorrhagic shock and cardiac tamponade.
Stroke volume is also determined by cardiac contractility which is defined as the extent of shortening that occurs in cardiac myocytes when stimulated independent of preload or afterload. It a function of cardiac muscle performance. Echocardiographic measures of shortening fraction and ejection fraction are typically used as estimates of contractility. Listeners need to remember that multiple factors affect contractility such as catecholamines as well as optimization of the so called cardiac lytes:- calcium, magnesium and potassium. contractility is decreased in cardiogenic shock, drugs/toxins or cardiomyopathy.
Afterload: is defined as the force opposing the contraction of the left ventricular myocytes during systole. Increased or decreased SVR can affect afterload in shock states
In the next section Lets us discuss the assessment of O2 delivery & consumption clinically at the bedside where it matters.:
How can you assess oxygen delivery and consumption at the bedside?
A physical exam we can assess peripheral perfusion, heart rate, blood pressure, urine output, and mental status.
Serial arterial blood gases, measures of serum lactate, SmVO2 (if available as SmvO2 requires pulmonary artery catheter), ScvO2, measure of Hgb, SaO2 can be obtained. A rise in lactate with falling ScVO2 or SmvO2 suggest anaerobic metabolism. A rising base deficit, persistent acidosis, decreasing pH may suggest declining DO2 in the right circumstances.
Blood lactate can be used as an indirect measure of perfusion. A temporal trend is more valuable than a single number. Rate of production and clearance is affected by liver metabolism.
Rahul, any serum biomarkers for assessment of cardiac function ?
Paige: B-type Brain natriuretic peptide (BNP):, troponin (specific to myocardium) Troponin increase is seen in myocarditis, pericarditis, coronary injury or occlusion, and sepsis. BNP is released in response to ventricular wall stress due to volume or pressure overload. High levels of circulating BNP have been correlated with congestive heart failure states—a trend over time is likely the most helpful for the clinician
Pradip, what can you tell us about Near-infrared spectroscopy?
NIRS helps assess the systemic and regional O2 transport. NIRS is commonly used, particularly in patients with CHD, as a means of trending regional DO2 or as a surrogate for mixed venous O2 saturation or systemic DO2. Frequently used on patients undergoing VA ECMO. Rahul, how can we improve oxygen delivery?
We can give patient a blood transfusion (although not ideal unless hgb < 7gm%) increase FIO2 to increase SAO2. We can decrease VO2 by reducing fever/catabolic states, treating infection, treating agitation with sedation/paralysis, cooling (while avoiding shivering), inducing coma etc. We can also decrease VO2 by early intubation if necessary in a patient with severe respiratory distress. Avoiding vasopressors can also decrease myocardial oxygen requirement and O2 consumption.
Pradip How can we tackle O2 consumption?
Let’s break this down in a systems based manner:
- Resp:
- Reduce respiratory distress by supporting using Ni or Inv MV
- Reduce arrythmia as this can increase VO2 but also derail CO and thus DO2
- Reduce pain agitation fever seizure or shivering. At times you may not have a great clinical assessment of subclinincal status so consider placing eeg on patient or intiating paralysis.
- ID decrease the burden of infection — you want to draw cultures and start broad spectrum ABX which we can later narrow.
Pradip, as we wrap up today would you have any clinical pearls for us regarding DO2 and VO2
- This was a great episode, and this concept is fundamental to Pediatric Critical Care Medicine
- I still remember having an index card which had components of oxygen delivery and oxygen consumption
- I Would encourage you as learners to frequently visit this at the bedside so you can think in a structured way
- Finally, Rather than delving into complicated formulas, understand the different variables in the equation, how you can measure them clinically, and which variables are most stressed in the formula.
To summarize today’s episode…
In summary, today we talked about oxygen delivery and oxygen consumption. Have a mental model remember the car which represents arterial oxygen content, and the motor of the car being cardiac output. We also reviewed Basics of cardiac physiology as cardiac output is the electrical activity of the heart time is the mechanical activity of the heart. Finally we shifted gears and talked about oxygen consumption and how increased oxygen consumption can decrease your mixed venous auction saturation and increase your arterial venous difference. Lastly, we created a model on how to clinically assess and modulate oxygen consumption.
This concludes our episode today on O2 delivery and O2 consumption. We greatly appreciate Learn PICU collaboration for content and we hope you found value in this podcastPlease visit learnpicu.com for additional information, figures and formulae. We welcome you to share your feedback & place a review on our podcast. PICU Doc on Call is hosted by me Pradip Kamat and my cohost Dr. Rahul Damania.
Stay tuned for our next episode! Thank you
Very good lecture